


 Oceanic and atmospheric conditions in the Atlantic basin are expected to produce more and stronger hurricanes this year compared to last, according to expert forecasters. But how accurate is the data?
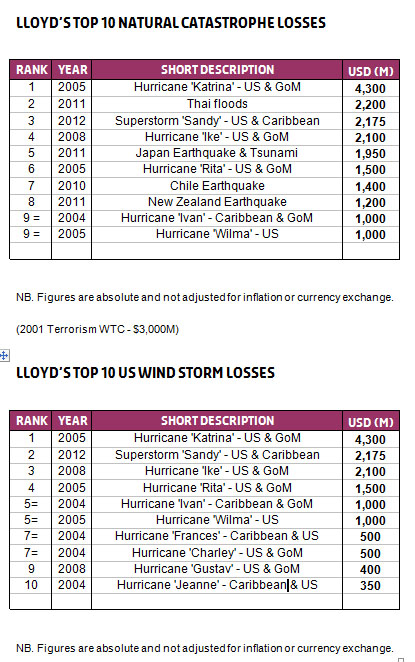
(source: Lloyd’s of London)
There is a growing consensus that this year’s hurricane season, which runs from 1 June to 30 November, could produce some costly destructive windstorms in the US and Caribbean.
Colorado State University opened the bidding last month when its respected forecasters professors Philip J. Klotzbach and William M. Gray of the university’s Department of Atmospheric Science stated they anticipated “an above-average probability for major hurricanes making landfall along the United States coastline and in the Caribbean”.
They said that the tropical Atlantic had anomalously warmed over the past several months, adding that the chances of an El Niño event this summer and autumn are unlikely. Both are factors that contribute to enhanced hurricane activity.
Klotzbach and Gray estimate that in 2013 the chances of a major hurricane making landfall in the US to be about 140% of the long-period average. A major storm is a Category 3 or higher, with winds in excess of 111 mph. Last year, there were 19 named storms, 10 of which became hurricanes. One became a major storm and four made landfall.
In its 2013 Atlantic hurricane season outlook issued on 23 May, the National Oceanic & Atmospheric Administration (NOAA) said there is a 70% likelihood of 13 to 20 named storms (winds of 39 mph or higher), of which seven to 11 could become hurricanes (winds of 74 mph or higher), including three to six major hurricanes.
Again, these ranges are well above the seasonal average of 12 named storms, six hurricanes and three major hurricanes
Above normal activity
The most recent forecast comes from Tropical Storm Risk (TSR), the consultancy firm affiliated to University College London and sponsored by Aon Benfield. Its 2013 hurricane season outlook is for overall activity about 30% above the long-term (1950-2012) norm but 10% below the recent 10-year (2003-2012) norm. This would equate to hurricane activity levels similar to those witnessed in 2012 and 2011.
TSR says there is 63% probability of above-normal US landfalling hurricane activity, a 21% likelihood of a near-normal season and only a 16% chance of a below-normal season. It expects four tropical storm strikes on the US, including two hurricanes. This compares to long-term norms of three and 1.5 respectively.
Hurricane forecasts help maintain a heightened awareness of hurricane risk among insurers and the general public – even if they are not always accurate. Only four of NOAA’s last 11 forecasts have been accurate.
The important point to keep in mind is that it only takes one significant hurricane to create the perception about how active a year has been, says Steve Bowen, senior scientist and meteorologist at Impact Forecasting, the catastrophe modeling arm of Aon Benfield
“For example, the 1992 Atlantic hurricane season – meteorologically – was very quiet. But that also happened to be the year Hurricane Andrew struck Florida as a Category 5 and caused $45bn in damage (2013 USD), ” Bowen told lloyds.com.
“The opposite extreme would be the 2010 Atlantic Hurricane Season that saw 19 named storms, 12 hurricanes and five major hurricanes develop. Since there were no hurricane landfalls in the US, the perception was that the year was very quiet – despite being tied as the third-most active season on record.”
Neil Smith, manager of emerging risks and research at Lloyd’s explains that forecasting hurricanes is not an exact science.
“Forecasts can provide an indication of overall levels of activity, but even then they do not include the key factor for insurers – whether hurricanes make landfall or not, ” he says. “However, forecasts and analyses based on the atmospheric state as well as Atlantic sea surface temperatures are likely to be more accurate than those that are not.”
Sandy – expensive and unexpected
Last year, Superstorm Sandy took everyone by surprise when it hit the north east coast of the US. The windstorm caused an estimated total of $70bn in economic losses, making it the second most damaging hurricane on record after Hurricane Katrina in 2005. Insured losses were around $35bn, out of which $20bn to $25bn were covered by the private insurance market.
The windstorm turned out to be one of the largest claims in Lloyd’s 325 year history, with the market paying out $2.2billion to policyholders in the Caribbean and North America.
According to Karen Clark of catastrophe risk management firm Karen Clark & Co, Sandy was unusual for two reasons : “The track was unusual in that it took a left turn into the coast when it was blocked by a strong high pressure system over the Northwest Atlantic. Storms usually run due north, ” she explains. “Also, Sandy was unusual for having such a large footprint.”
Clark says that having a repeat of Sandy is actually less likely than a “regular” Cat 2 storm tracking due north and hitting densely populated parts of the north-east. “That kind of event, with more severe wind damage spread out along the east coast, Long Island into Canada, would be a lot more expensive than Sandy, ” she says.
More intensity
Clark says that the latest research collected by the Intergovernmental Panel on Climate Change (IPCC) points to a decrease in the frequency of tropical cyclones but expects an increase in intensity over time. “That is beginning to be reflected in what we are seeing in the data, ” she says. “Interestingly there is no evident trend for more landfalling hurricanes. But storms do seem to be a little more intense with climate change.”
“Further research is required on Atlantic climate variability and its impact on hurricane formation and tracks – particularly in light of the increasing evidence that climate change is leading to more frequent, severe weather events including storms and hurricanes, ” explains Smith.
Impact Forecasting’s Steve Bowen says that extended range forecasts, particularly the April forecasts, are useful in providing a real-time look at the atmospheric and global indicators that will ultimately play a role in determining how active (or inactive) an upcoming hurricane season may be.
“Using the April prognostications as an example, forecasters are able to use the current indicators to compare with past seasons to determine the level of activity that may be experienced. Going forward, this climatological data will hopefully become useful in determining possible trends, ” he says.
The ‘active’ ingredients
The Lloyd’s report, Hurricanes and Long-term Climate Variability, explains the different climate influences on hurricane development and tracks.
The severity and frequency of hurricanes are influenced by changes in the climate of the Atlantic over the long term, and in particular, changes over many decades of sea surface temperatures – the Atlantic Multi-decadal Variability (AMV).
Forecasters believe three climate factors that strongly control Atlantic hurricane activity will come together this year to produce an active 2013 hurricane season.
These are:
• A continuation of the atmospheric climate pattern, which includes a strong west African monsoon, that is responsible for the era of high activity for Atlantic hurricanes that began in 1995;
• Warmer-than-average water temperatures in the tropical Atlantic Ocean and Caribbean Sea;
• El Niño, which suppresses hurricane formation, is not expected to develop.