For the 38 th consecutive year the GSCC presents statistical data, in the form of 11 tables on Greek controlled ships over 1,000 GT, registered under the Greek and other flags. The data has been provided by S&P Global Market Intelligence. The following is a short analysis of the data provided, prepared by the GSCC Secretariat.
Information from Table 1, compared with corresponding data from the previous year, shows
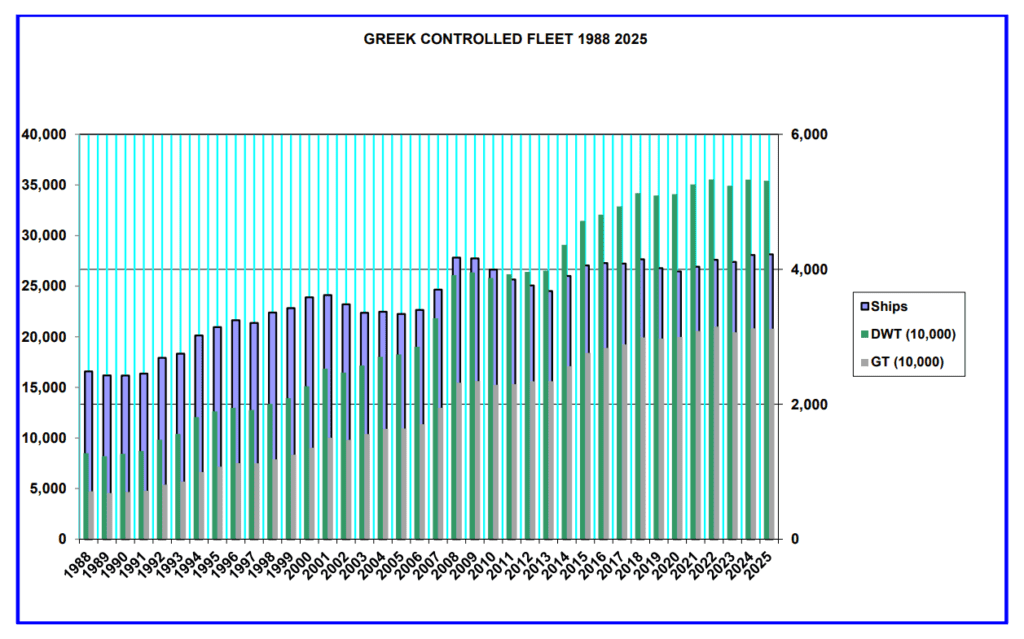
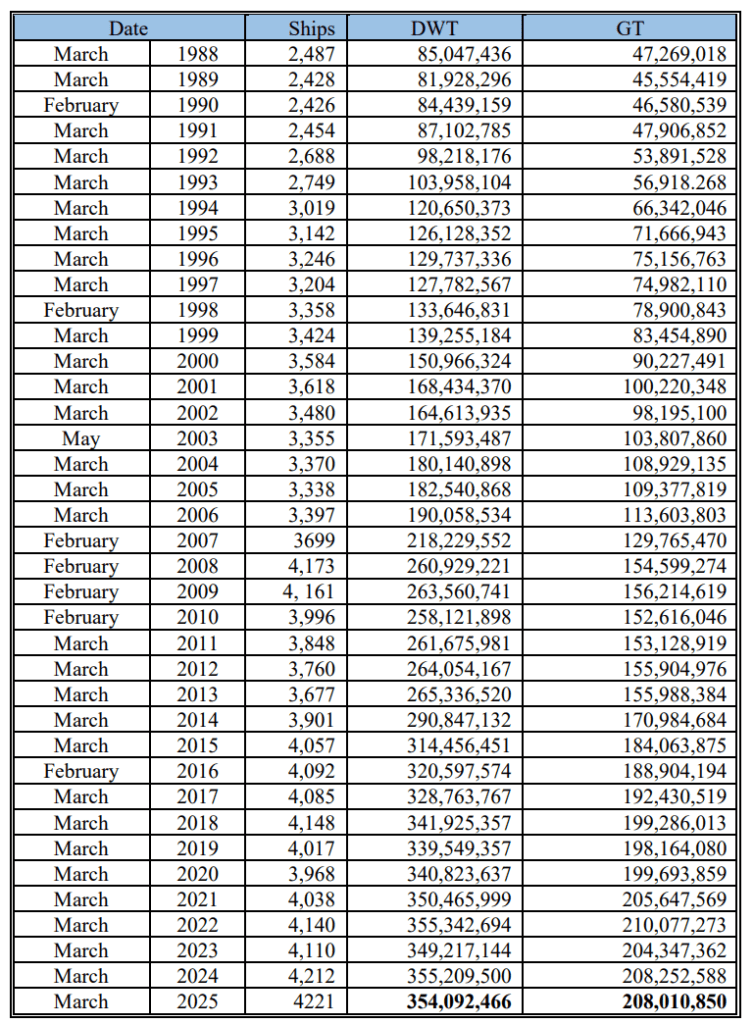
that, during the year to March 2025, the Greek controlled fleet has increased in terms of number of vessels and slightly decreased in terms of DWT and GT. According to the data, as of 03.03.2025, Greek interests controlled a record 4,221 vessels of various categories, of
354,092,466 total DWT and 208,010,850 total GT. Compared with the previous year’s data,
this represents an increase of 9 vessels and decrease of 1,117,034 DWT and 241,738 GT. The
figures do not include 456 vessels of various categories on order from shipyards, a total of
43,186,564 DWT and 27,035,837 GT. Interestingly, the orderbook figures represent a 23%
increase, which indicates a larger interest in new technology vessels by Greek owners.
The fleet registered under the Greek flag has slightly decreased in terms of ship numbers,
still comprising of 480 ships. This reflects the need for the Greek flag to be less
bureaucratic and more flexible. Also, a slight decrease in terms of DWT and GT has
been noted, with the figures now standing at 29,551,538 GT and 48,717,807 DWT, as
opposed to the previous year’s figures of 30,759,394 GT and 51,694,269 DWT.
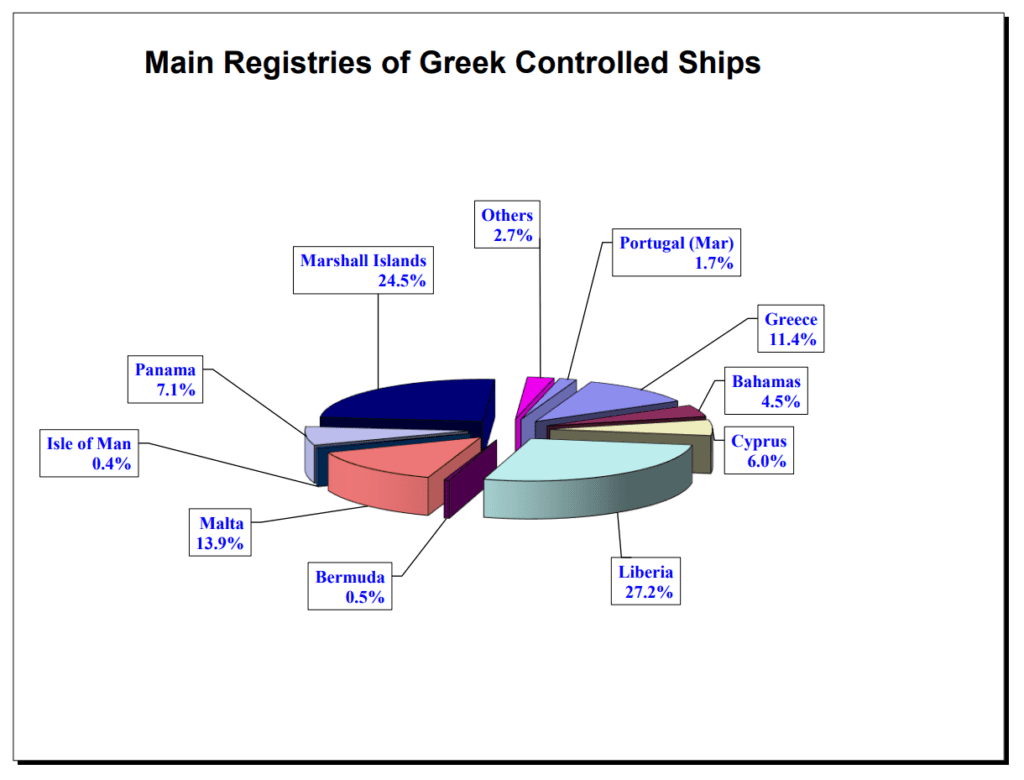
TABLE 1: Flag Analysis of Ships owned by Greek Parent Companies
The Greek controlled fleet is registered under some 29 flags.
Flag analysis of ships owned by Greek parent companies, which gives the total number
of ships, total DWT and total GT, registered under each of the main registries used by
Greek owners, compared with the corresponding table of last year, shows that Portugal
gained a record of 62 vessels, Malta gained 51 ships, Cyprus gained 19 ships and
Bermuda 1 ship.
On the other hand, the remaining flags noted a slight decrease in the number of registered
vessels, with the Marshall Islands 60 ships, Panama 27 ships, Bahamas 12 ships, while
Liberia 10 ships and Isle of Man 1 ship.
As mentioned before, the number of vessels registered under the Greek flag slightly
decreased this year by 16 vessels, and also a slight decrease in terms of DWT 2,976,462
and in terms of GT 1,207,856.
The table below shows the gains and losses in number of ships, GT and DWT for the
main registries of Greek controlled ships.

Overall, the Liberia and Marshall Island flags are at the forefront of the Greek owned
fleet with 1,149 and 1,036 Greek owned ships, respectively, on their registers. In terms
of DWT, Liberia accounts for 103,121,400, representing 29.1%, Marshall Islands
accounts for 81,845,098, representing 23.1 % and Malta with 587 ships of 53,575,910
DWT, representing 15,1% of the total DWT of the Greek owned fleet.
The Greek flag stands with 480 ships of 48,717,807 DWT. It should be noted that the
Greek flag remains in the fourth place globally in terms of DWT, as it represents 13.8%
of the total DWT of the Greek owned fleet.
In terms of DWT, Panama follows with 300 ships of 20,054,910 DWT, Cyprus with
253 ships of 18,561,879 DWT and Bahamas with 190 ships of 15,904,923 DWT.
Furthermore, it should be noted that the total number of vessels registered under EU
flags stands at 1,414, which accounts for 33,5% of the Greek fleet. This figure has
increased, when compared to the previous year’s figure of 1,278 vessels, which
represented for 30,3% of the Greek fleet.
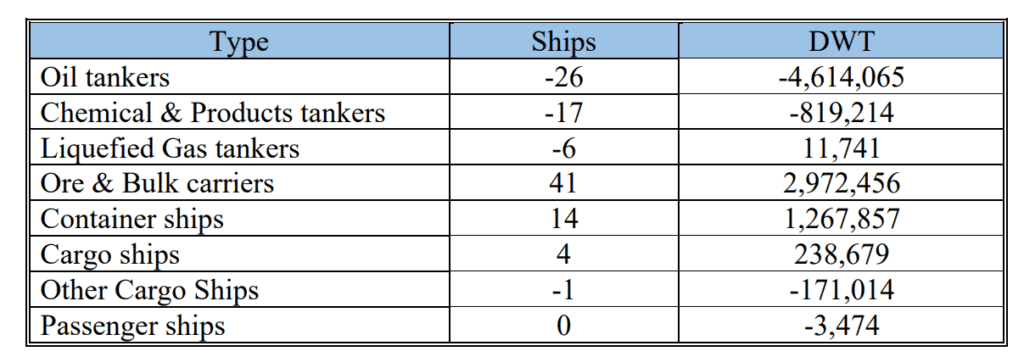
TABLE 2: Ship Type, DWT and Order Book – Greek Parent Companies
Comparing Table 2 with the corresponding table of the previous year, the following
increases/decreases in number of ships and DWT are noted.
With regard to the order book as to ship type, currently there are 157 oil tankers on order
for account of Greek owners, 66 chemical & products tankers, 54 liquefied gas tankers,
132 ore & bulk carriers, 23 container ships, and 10 cargo vessels on order.
TABLES 2 & 3: Comparison between the world fleet and Greek owned fleet per
ship type
The following table presents the Greek controlled fleet in number of ships, in
comparison with the world fleet, providing the figures as to ship type.
What is notable is that Greek parent companies represent 22.7% of the world tanker
fleet, 15.8% of the world Ore and Bulk fleet and 9.4% of the Liquified Gas fleet

Overall, as shown in Table 4 of the attached data, the Greek owned fleet stands at 6.5%
of the world fleet in terms of ship numbers, 12.3% in terms of GT and 14.5% in terms
of DWT.
The Greek registered fleet as a percentage of the world fleet, in terms of number of ships,
GT, and DWT is 0.7, 1.8 and 2.0 respectively, according to Table 9. It should be noted,
however, that for oil tankers the percentages are 5.1, 5.6 and 5.7 respectively.
TABLES 3 & 4: Ship Type of the World Fleet and the Greek Fleet
Due to the unstable situation in Ukraine/Russia and the Red Sea as well as the forthcoming regulatory requirements, slight increases and decreases were noted in most of the categories of the Greek owned fleet.
In particular, slight decrease in the Greek fleet as a percentage of the world fleet was
recorded in all categories of ships, in relation to the corresponding world fleet type for
the year 2024.
Compared to the previous year, the percentages are as follows:
Oil Tankers
Percentage in terms of number of ships 2024: 23.7
Percentage in terms of number of ships 2025: 22.7
Percentage in terms of total DWT 2024: 22.8
Percentage in terms of total DWT 2025: 21.9
Chemical & Products Tankers
Percentage in terms of number of ships 2024: 5.6
Percentage in terms of number of ships 2025: 5.3
Percentage in terms of total DWT 2024: 11.0
Percentage in terms of total DWT 2025: 10.3
Liquefied Gas Carriers
Percentage in terms of number of ships 2024: 10.1 Percentage in terms of number of ships 2025: 9.4
Percentage in terms of total DWT 2024: 13.4
Percentage in terms of total DWT 2025: 12.5
Ore & Bulk Carriers
Percentage in terms of number of ships 2024: 16.1
Percentage in terms of number of ships 2025: 15.8
Percentage in terms of total DWT 2024: 18.4
Percentage in terms of total DWT 2025: 18.2
Container Ships
Percentage in terms of number of ships 2024: 6.0
Percentage in terms of number of ships 2025: 5.8
Percentage in terms of total DWT 2024: 5.7
Percentage in terms of total DWT 2025: 5.5
Cargo Ships
Percentage in terms of number of ships 2024: 1.5
Percentage in terms of number of ships 2025: 1.4
Percentage in terms of total DWT 2024: 2.6
Percentage in terms of total DWT 2025: 2.6
Other Cargo Ships
Percentage in terms of number of ships 2024: 0.5 Percentage in terms of number of ships 2025: 0.4
Percentage in terms of total DWT 2024: 1.1
Percentage in terms of total DWT 2025: 0.9
Passenger Ships
Percentage in terms of number of ships 2024: 2.0
Percentage in terms of number of ships 2025: 2.0
Percentage in terms of total DWT 2024: 2.6
Percentage in terms of total DWT 2025: 2.5
TABLES 5, 6 & 10: Average Age Analysis of Existing Ships owned by Greek Parent Companies, Registered ships and the World Fleet
The average age of the Greek controlled fleet in terms of ships increased slightly
compared to the previous year, but, nevertheless, continues to be 4.3 years below the
average age of the world fleet.
The average age of the Greek controlled fleet in terms of ships now stands at 14.2 years,
in comparison to 18.5 years for the world fleet. In terms of GT and DWT, it is 12.6 and
12.5 years respectively, as against 13.5 and 13.3 of the world fleet.
The average age of the existing Greek flag fleet recorded a slight increase in terms of
ship numbers, now standing at 16.3, in comparison to 15.5 in 2024. A slight increase
has also been noted in terms of GT and DWT, with values of 10.7 and 10.3 respectively,
as against 10.3 and 9.9 years in 2024.
TABLE 7: Class Analysis of Greek Parent Companies
The following six major international classification societies have the majority of the
Greek controlled fleet on their books:
- ClassNK: 849 ships (825 ships in 2024),
- Lloyd’s Register: 742 ships (761 ships in 2024),
- BV: 734 ships (736 ships in 2024),
- ABS: 730 ships (748 ships in 2024),
- DNV: 601 ships (609 ships in 2024) and
- RINA: 318 ships (289 ships in 2024)
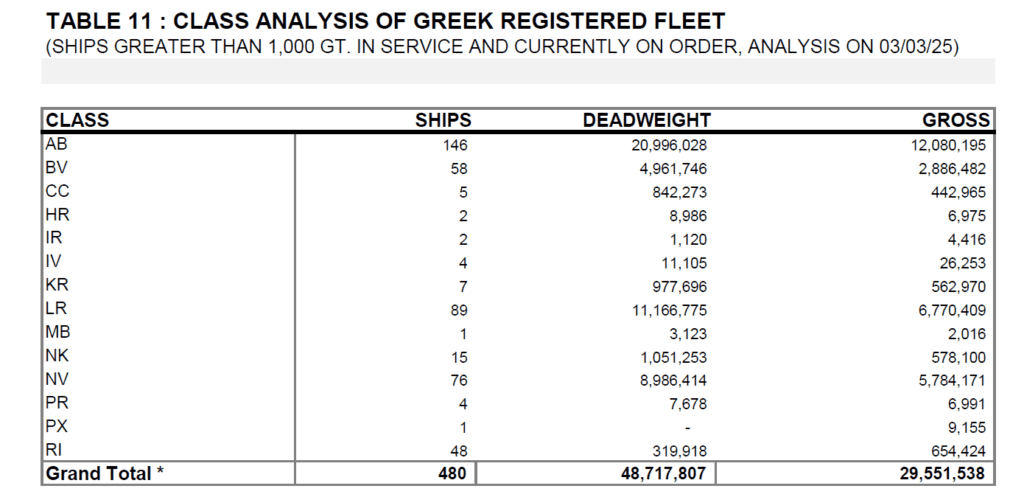
TABLE 11: Class Analysis of Greek Registered Fleet
The following eight major classification societies have the majority of the Greek
registered fleet on their books:
- ABS: 146 ships (143 ships in 2024),
- Lloyd’s Register: 89 ships (90 ships in 2024),
- DNV: 76 ships (83 ships in 2024),
- BV: 58 ships (58 ships in 2024),
- RINA: 48 ships (44 ships in 2024),
- ClassNK: 15 ships (15 ships in 2024),
- KR: 7 ships (9 ships in 2024) and
- CCS: 5 ships (19 ships in 2024).