


The following analyses are a contribution from the members of the Shipping Analytics Research Team: Dr. Michael Tsatsaronis, Prof. Theodoros Syriopoulos, and PhD cand. Xakousti Merika, providing an academic and data-driven overview of the Tanker and Dry Bulk markets for May 2026.
Tankers – May 2026: Market Review & Outlook
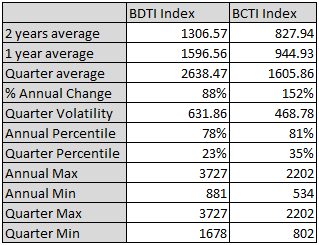
The tanker market eased from its first-quarter extremes in May while remaining well above normal levels. The Baltic Dirty Tanker Index closed at 2,088 and the Baltic Clean Tanker Index at 1,557, both above their one-year averages (roughly 1,597 and 945) and their two-year averages (roughly 1,307 and 828). On an annual basis the dirty index sits at the 78th percentile and the clean at the 81st. On a quarterly basis the dirty index has fallen to the 23rd percentile and the clean to the 35th. Month-end rates are therefore high relative to the year and low relative to the second quarter, which indicates a consolidating market. Rates have declined from the quarter’s peak and remain above their longer-term averages.
The character of the market changed through the month, from crisis-led pricing to risk-premium pricing. Rates had responded directly to disruption, route uncertainty and concern over Middle Eastern exports; by May those pressures were being absorbed and rates did not return to normal levels. The market is now pricing the standing risk premium left by the disruption, reflected in routing, voyage planning and energy security.
Table 1: BDTI and BCTI Analytics
The gap between crude and product tankers widened. Crude carriers held firm overall, supported by longer voyage distances, limited vessel availability and continued uncertainty over crude flows. That headline firmness masks a widening split by basin: Arabian Gulf earnings remained exceptionally high on Strait of Hormuz risk, while the Atlantic and other regions softened as vessel supply began to outpace cargo demand. The blended dirty index therefore overstates the strength now available outside the Gulf. Product carriers eased more clearly as arbitrage opportunities narrowed and refined-product movements adjusted, although clean earnings remained profitable by historical standards. The correction represents a normalisation from extreme levels.
Inventories remained central to the market, with the tanker complex still in an inventory-driven pause. Global crude stocks continue to matter more than headline demand and Chinese stocks are particularly important: large inventories suppress immediate import requirements, while continued drawdowns elsewhere increase the likelihood of an eventual restocking cycle. The next significant catalyst for crude tankers is therefore more likely to come from the timing and scale of replenishment than from geopolitics directly.
The secondhand market also cooled, recording 30 tanker sales in May, around 2.78 million deadweight, roughly half of April’s 65 and below the 81 and 69 recorded in January and February. Activity has eased from an exceptional pace to a more normal one. Liquidity remains and the urgency has reduced.
Ordering nevertheless increased. Tanker contracting above 10,000 deadweight ran roughly 130 percent ahead of a year earlier in vessel numbers and about 124 percent ahead in deadweight. The comparison, however, is made against an unusually low spring of 2025; The increase therefore reflects a recovery in appetite from a low base.
This does not yet threaten the near-term supply balance. The tanker orderbook is concentrated in later delivery years, spread across 2026 to 2029, leaving the market protected from immediate supply pressure. Demolition remained very low in absolute and fleet terms, single digits against a fleet of approximately 18,000 vessels. The latest reported month, April, recorded six removals, at the higher end of the past two years’ range. Scrapping remains minimal relative to the fleet and owners are retaining most older tonnage.
The tanker market has moved past its peak without weakening. It is consolidating at a high level: rates have declined from their crisis highs, while inventories, energy security, fleet availability and route risk continue to support owners. The main uncertainty is whether the expected inventory drawdowns lead to a restocking cycle.
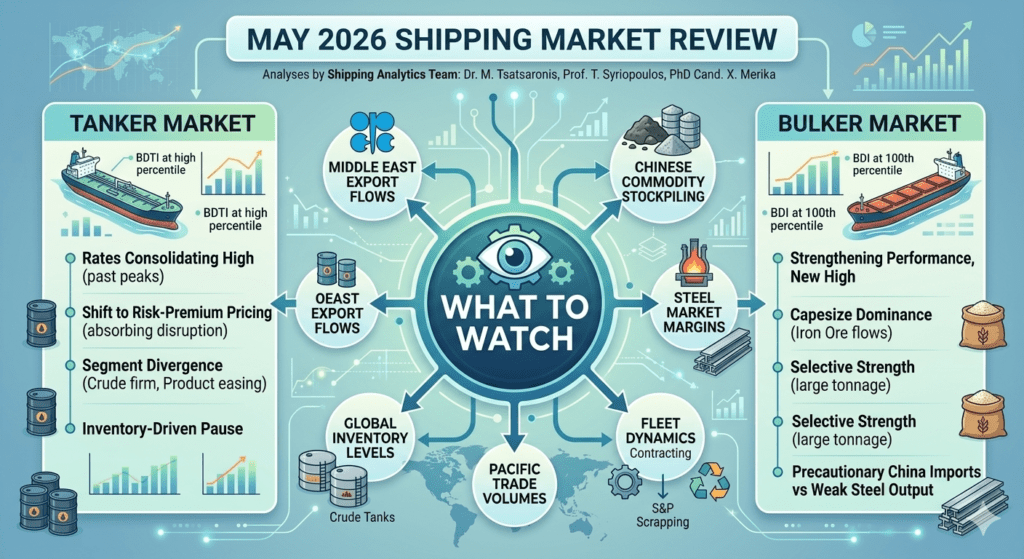
What to watch: Middle East export flows, the Arabian Gulf to Atlantic earnings spread, the trajectory of crude inventory drawdowns, Chinese stockpiling behaviour, refinery utilisation, the pace of new tanker contracting and demolition levels.
Bulkers – May 2026: Market Review & Outlook
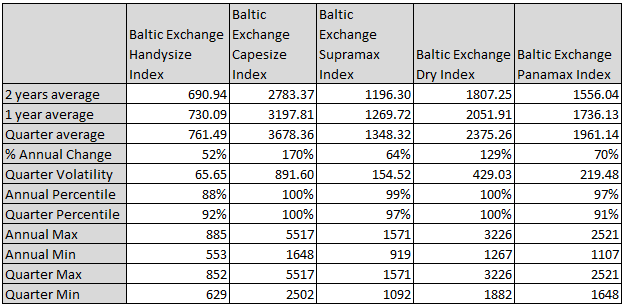
The dry bulk market strengthened in May while the tanker market eased. The Baltic Dry Index closed at 3,226, the highest level in the two-year series and therefore at the 100th percentile of both its annual and quarterly range, well above its one-year average of about 2,052 and its two-year average of about 1,807. Dry bulk accelerated into May and was the strongest of the major segments on a cycle-position basis.
Capesize was the main driver. The Baltic Capesize Index closed at 5,517, also at the 100th percentile of the month’s recorded BCI levels, supported by limited tonnage availability and firm Pacific employment. The cargo behind it is more unusual than the rate alone suggests. Chinese iron ore imports rose about 8 percent year-on-year over the first four months to roughly 419 million tonnes, with April alone near 104 million tonnes, even as crude steel output fell to its weakest April since 2018. Imports rose while steel production declined, a decoupling driven by precautionary buying: the Strait of Hormuz closure prompted mills and traders to secure cargo against future disruption and a price held near 105 dollars a tonne for months encouraged accumulation. Brazilian arrivals, the longest haul and the most Capesize-intensive, surged about 23 percent year-on-year in April, which is the direct source of the tonne-mile demand behind the index.
Table 2: Dry Bulk Baltic Indices Analytics
The mid-month decline did not persist. The headline index had fallen 5.08 percent on the week to 22 May and Panamax 11.82 percent. Over the following four sessions the Capesize index rose from 4,954 to 5,517 by the 28th, a gain of more than 11 percent and a new high for the series at month-end. The headline index recovered from 2,991 to 3,226 and Panamax from 2,223 to 2,331. The late-May decline was a temporary pause within a continuing advance. Forward projections are consistent with this, placing Capesize at roughly 35,000 to 40,000 dollars a day, Panamax at 18,000 to 20,000, Supramax at 17,900 to 19,900 and Handysize around 14,800.
This makes the headline BDI an incomplete measure of market health, as May’s strength was concentrated. The index reached an annual high mainly because Capesize surged, while the other segments participated to varying degrees. Supramax was strong, with the BSI closing at 1,569, the 99.2nd annual percentile. Panamax was firm at 2,331, the 97.3rd percentile. Handysize improved to 847 but lagged the larger classes, at around the 88th annual percentile. The rally was led by large tonnage and specific cargoes: iron ore for Capesize, coal for Panamax and Supramax in the Pacific and grain in support. The strongest support came from industrial bulk commodities.
This concentration is the main risk and the nature of the dependence matters. The import strength rests on inventory and precautionary behaviour rather than end-demand: Chinese port stocks stood near 171 million tonnes at the end of May, close to record levels, while domestic steel consumption fell 5.4 percent in 2025 with a further decline expected in 2026 as the property downturn persists. Margins are under pressure from a late-May coking coal price spike following the Shanxi mining accident, which has capped iron ore in a 105 to 110 dollar range. A market this reliant on Capesize is therefore exposed less to a fall in Chinese steel output, which is already weak, than to the point at which near-record port inventories stop building and mills slow seaborne purchases. A normalisation of stockpiling would remove the tonne-mile support quickly.
Asset-market activity remained constructive, with 295 dry bulk carriers sold over January to April 2026 against 243 a year earlier, a 21 percent increase. This indicates an active secondhand market in which owners continue to pay elevated prices for tonnage.
Newbuilding activity increased, with fresh Kamsarmax ordering including EuroDry booking two vessels at Hengli in Dalian for 2029 delivery and bulkcarrier orders up more than fourfold on a year earlier. The percentage is large but mainly a base effect, since the year-earlier spring recorded only about ten bulk orders. Relative to the fleet, ordering has recovered to a manageable level. The orderbook stands at about 11 percent of the fleet overall: 13 percent for Capesize, 14 percent for Panamax, 11 percent for Handymax and 7 percent for Handysize.
Demolition activity remained very low. Recycling across all dry bulk classes was minimal, only single vessels per month where any occurred and scrapping continues at a slow pace. Low scrapping is consistent with the freight, secondhand and ordering data: owners expect earnings to remain attractive enough to keep older vessels in service.
Dry bulk is strong and increasingly selective. The headline BDI reflects an uneven structure: Capesize leading, Supramax and Panamax close behind and Handysize lagging. The market should be assessed by segment, not by the BDI alone.
The outlook remains constructive but depends on commodity concentration. If iron ore imports hold and Chinese port stocks keep building, Capesize momentum can hold and steady coal and grain flows should keep Panamax and Supramax resilient. Because the rally depends on a narrow set of vessel classes and cargoes and on stockpiling rather than underlying steel demand, a slowdown in Chinese restocking or Pacific trade could affect sentiment quickly.
What to watch: Chinese iron ore import volumes and port inventory levels, steel margins and the coking coal price, Brazilian and Australian iron ore exports, Pacific coal demand, grain flows, Capesize tonnage availability, secondhand asset values, the pace of dry bulk contracting and demolition levels.